
Define a KPI once. Everyone reads the same number.
Reporting arguments are rarely about the data. They are about two teams calculating the same figure two different ways. Define the measure once, publish it, and let people drill it themselves from the year down to a single shift, without writing a query and without waiting on a report request.
In use today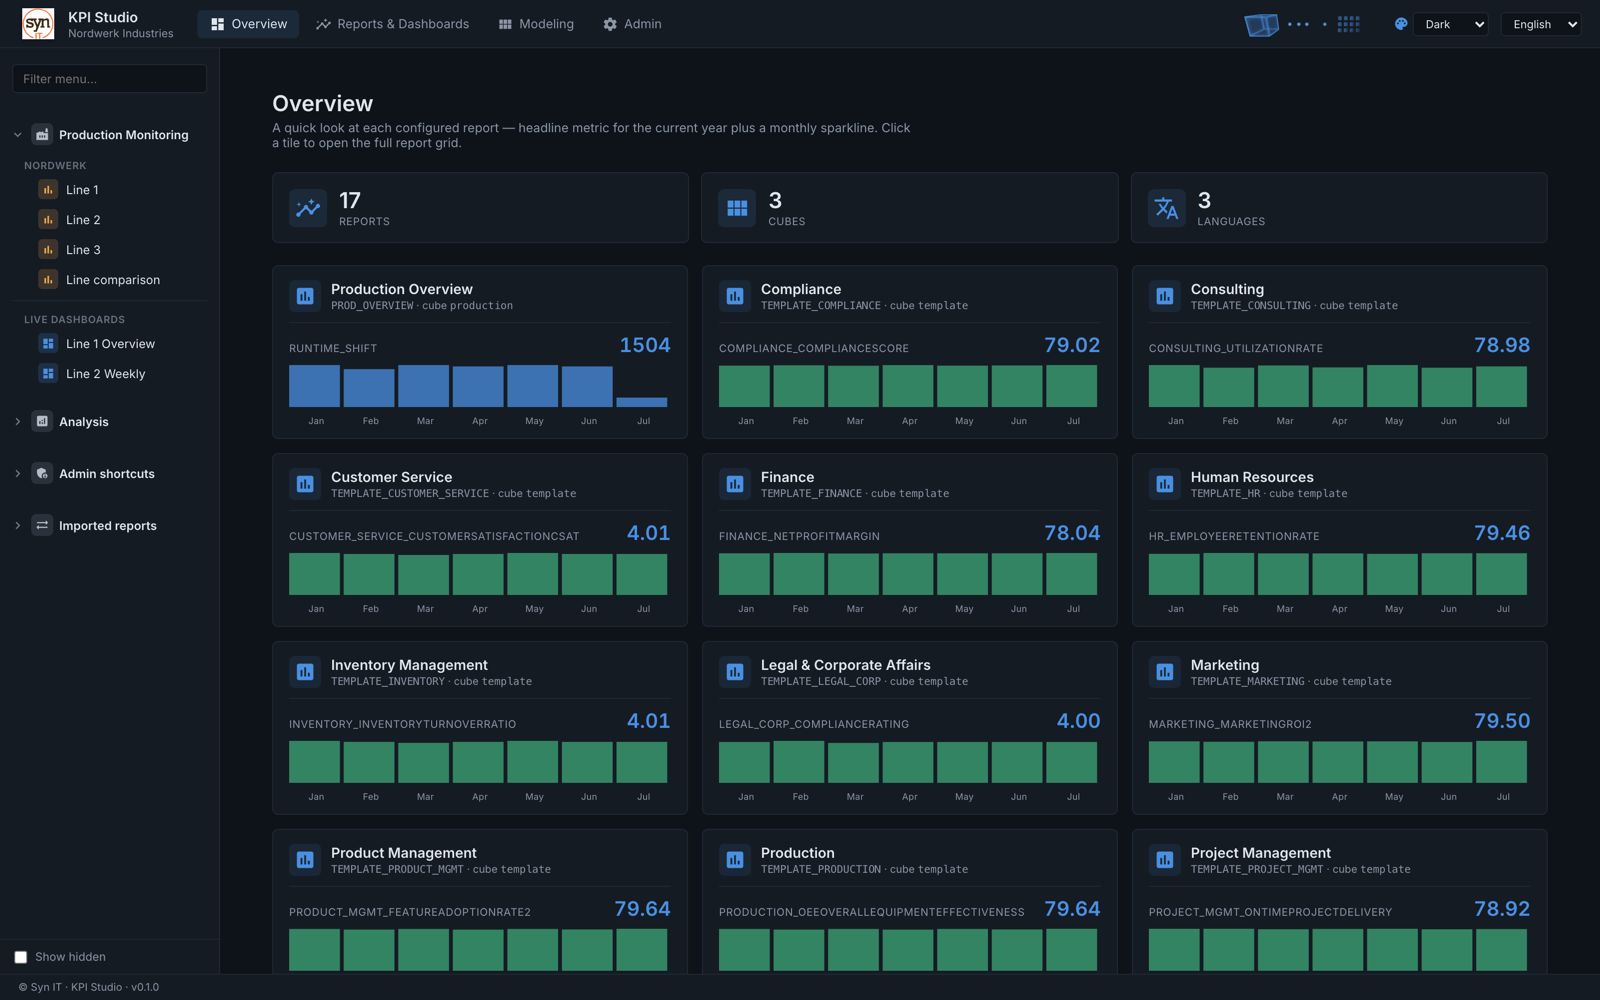
The problem it removes
Two departments, one metric, two answers.
Somebody divides by the calendar month, somebody else by the production month. One counts in hours, the other in seconds. Both are convinced they are right, and the meeting is spent reconciling instead of deciding. Publish the definition once and that argument stops happening.
One definition, one number
A measure is defined in one place and published for everyone to use. Reports do not each carry their own version of the calculation, so the figure on the board pack and the figure on the line screen are the same figure.
Drill from the year to the shift, and keep your place
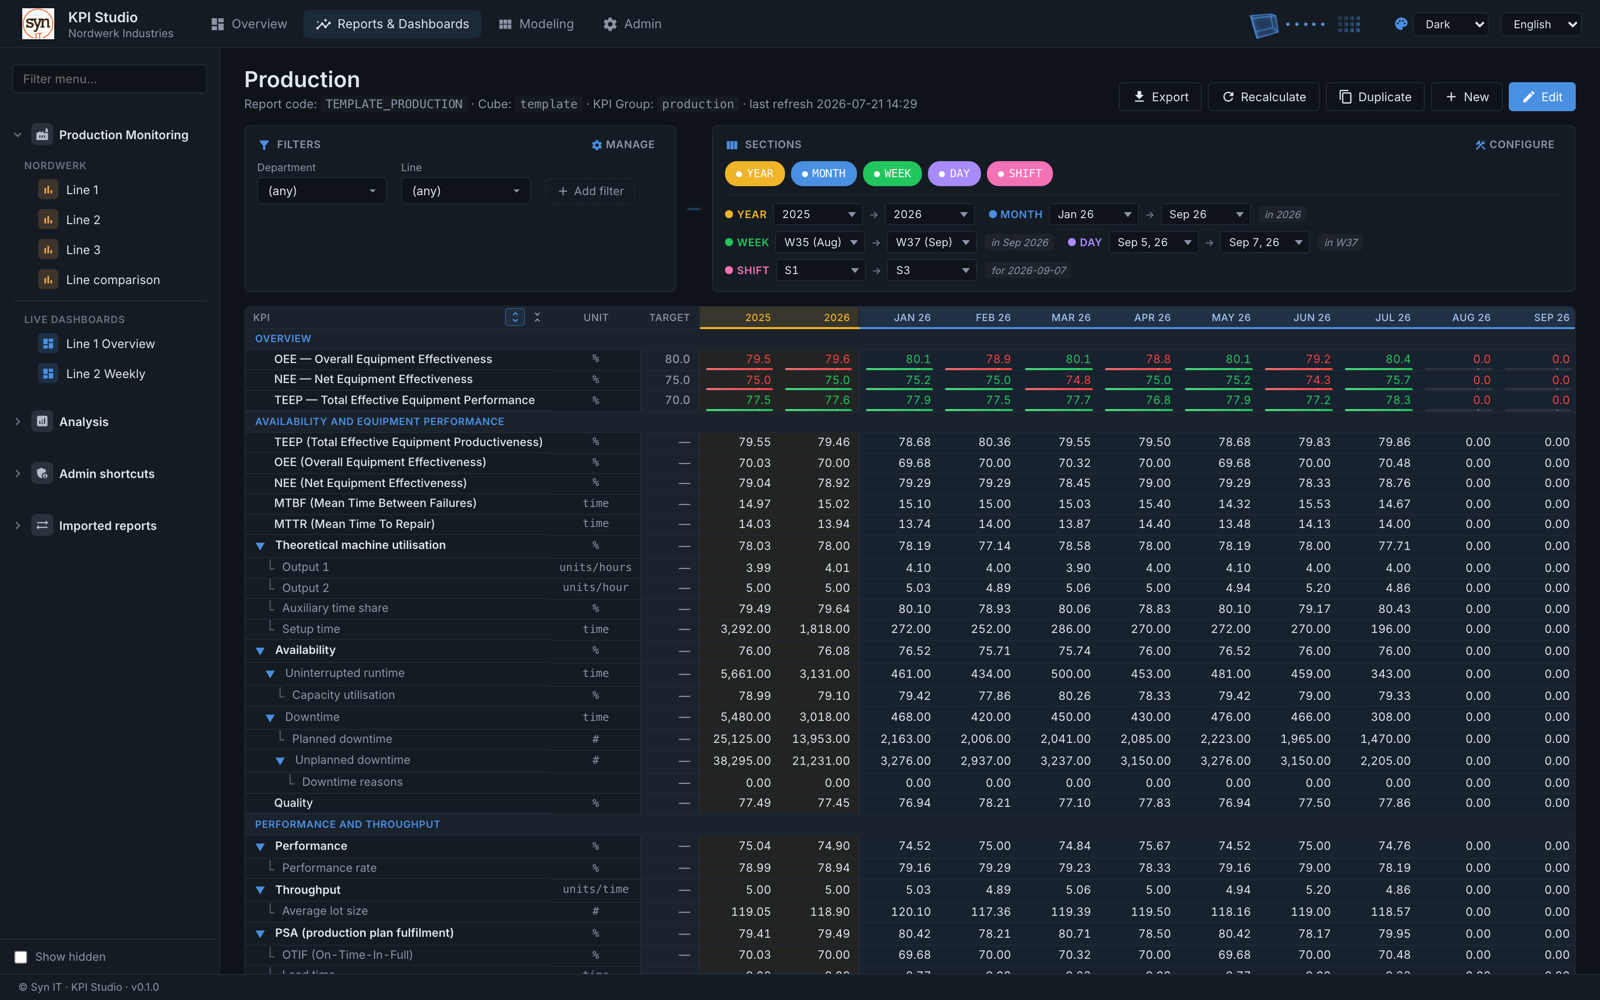
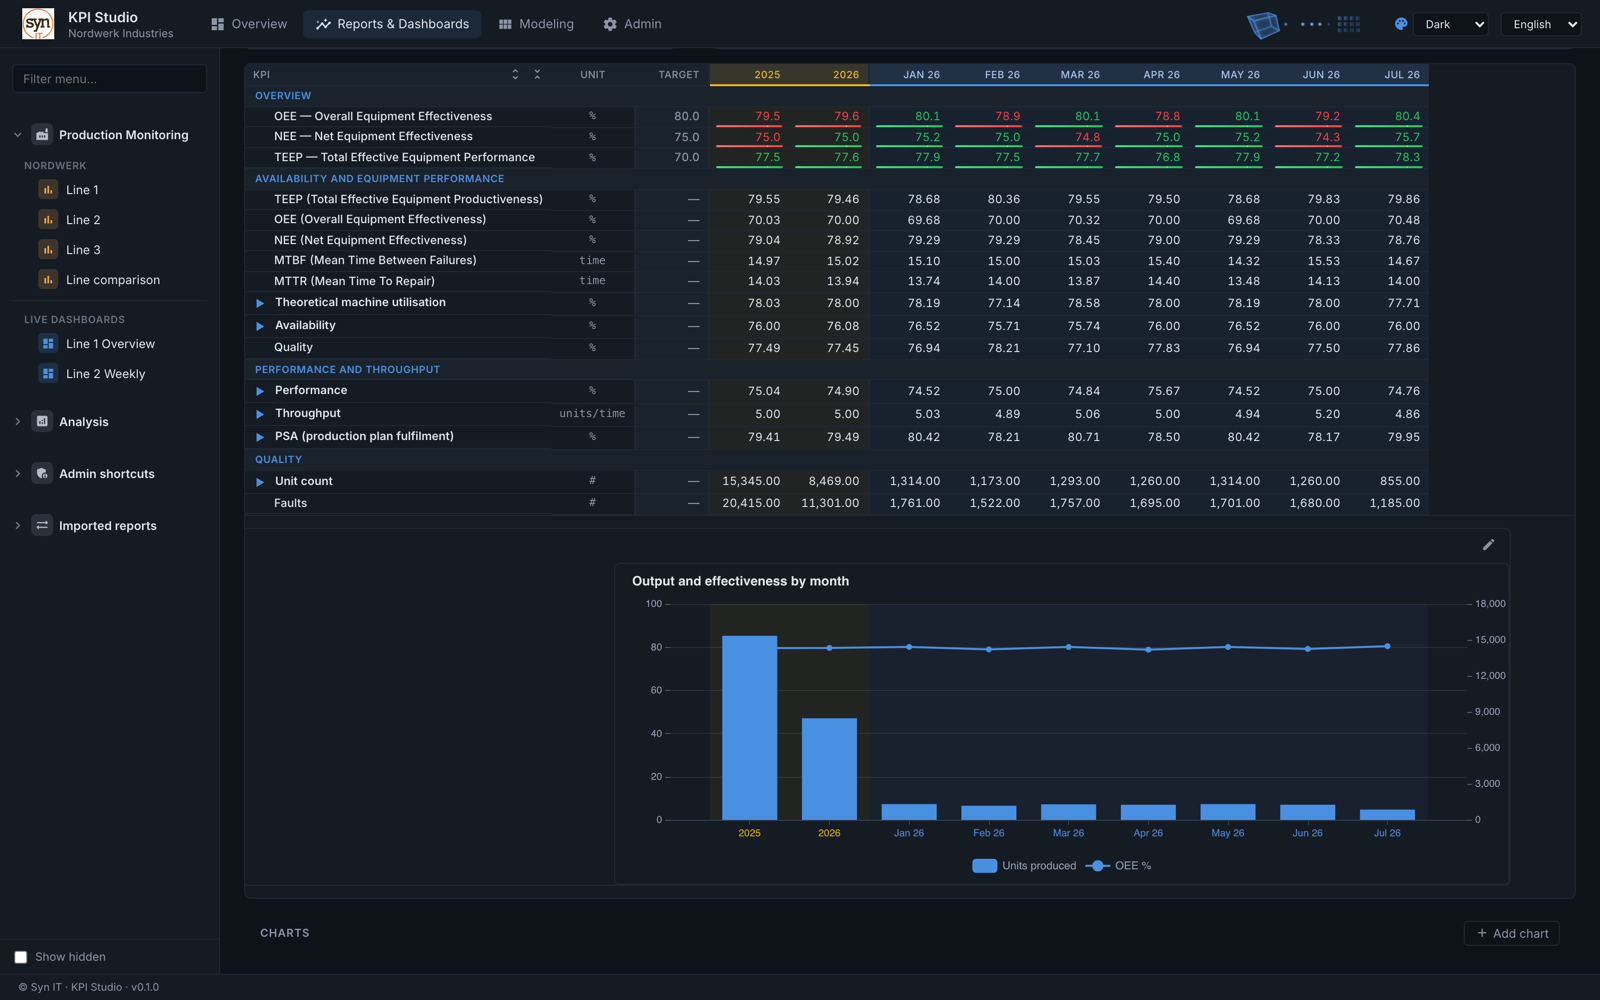
Year, month, week, day, shift. Open a level and the children appear underneath while the row you started from stays where it was, so you keep your bearings instead of losing the thread three levels down.
Units are settled at the source
Hours are stored as hours and kilograms as kilograms, checked when the data arrives. No report has to divide by three thousand six hundred, and nobody has to remember which of two similarly named columns is the one in seconds.
Your financial year, not just the calendar one
An April to March year, a shift pattern that starts at six, lines and departments the way your plant is really organised. You configure it and rebuild whenever it changes, as often as you like.
A breakdown that follows the data
One line can break itself out by whatever is actually there: the products that ran, the reasons a line stopped, the shifts that worked. You describe the breakdown once and the report grows the columns it needs at the moment somebody opens it.
Nothing disappears by accident
Deleting a language, a user or a menu entry moves it to a recycle bin first, and one screen restores it. Nobody has to raise a ticket because a configuration entry was removed on a Friday afternoon.
What it does
Everything the drill loop from board to shift needs.
Measures
Define it once, publish it to everyone
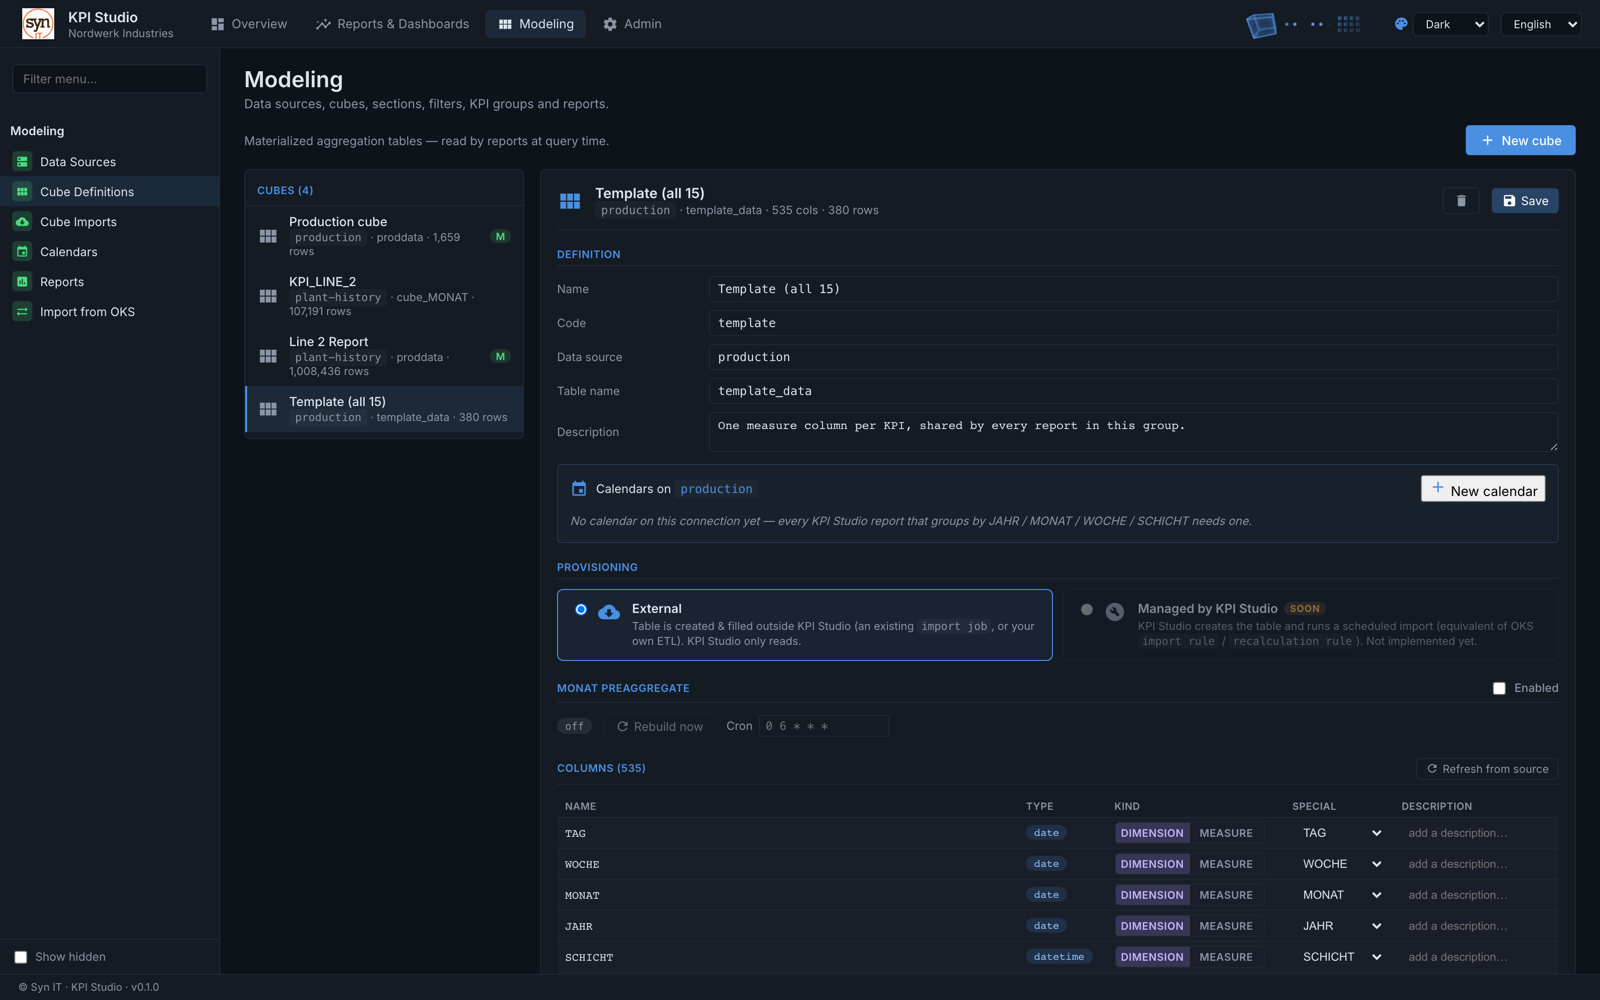
A measure names what it counts, where it comes from and how it is calculated. Report authors use it by name and never see the mechanics, so a correction to the definition corrects every report at once.
- One calculation per measure, centrally owned
- Reports reference the measure, not a copy of it
- Corrections apply everywhere immediately
Time
Year, month, week, day and shift as first-class levels
Time is modelled properly rather than parsed out of a date column: your shift pattern, your lines, your departments and your financial year offset.
- Financial year configurable per calendar
- Shift patterns, lines and departments
- Rebuild is safe to repeat at any time
Reports
The grid fills in as the answers arrive
A report opens immediately and each figure appears as it is calculated, so one slow corner never blocks the whole page. People stop staring at a loading spinner and start reading.
- Nothing waits on the slowest cell
- Drilling keeps the current row visible
- Wide reports scroll without losing the labels
Breakdowns
Sub-figures generated from the data itself
Describe the rule once (break this by product, by stop reason, by shift) and the report produces one column per value it actually finds, in the order you asked for.
- No maintenance when a new product appears
- Live preview while you define the rule
- Labels resolve in the reader’s language
Languages
Everyone reads it in their own
Report titles, level names and labels come out in the language of the person looking at them, so one report definition serves the whole group.
- Per-user language, not per-installation
- Applies to report content, not only menus
- New languages added without touching reports
Data sources
Reads the systems you already have
It reads from your existing production databases and from plant-floor data collection, so you do not need a separate warehouse project before the first report can go live.
- Existing databases as a source
- Plant-floor machine data as a source
- No warehouse project required to start

How it runs
It installs in your own data centre, on the cluster you already operate, or hosted by us in the region you choose, and signs people in through your existing identity provider. Reports read the data where it already lives, so the first useful report does not wait on a data-migration programme.
Works with the rest of the range
The measures published here are the same ones the plant-floor products feed, so an operations screen and a group report are the same numbers at different depths. An automation can also compile and send a report on a schedule, without anybody opening a spreadsheet.
How to start
Bring the report your teams argue about.
Pick the one figure two departments calculate differently. We model it with you, publish it once, and show both readings landing on the same number.